Loading...
elearning Campus BlogWhat is an Indifference Curve
What is an Indifference Curve

An indifference curve is a graphical representation of two goods that provide a consumer with the same level of satisfaction. It illustrates the points where a consumer is indifferent between various bundles of goods because they offer equal levels of utility or well-being.
In this blog, you will learn the indifference curve definition, map, analysis, and properties.
Explanation of Indifference Curve
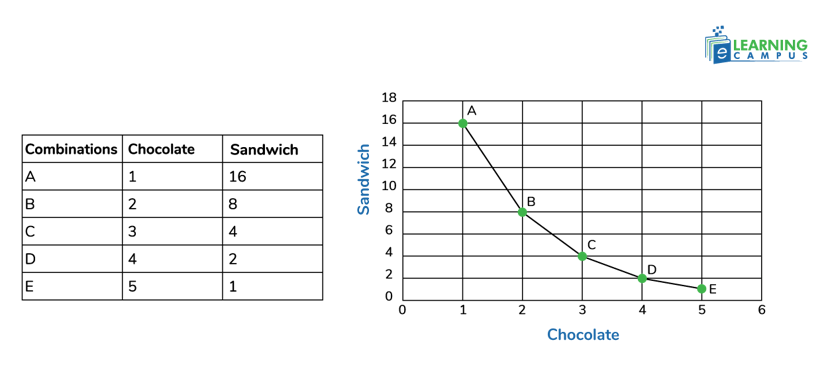
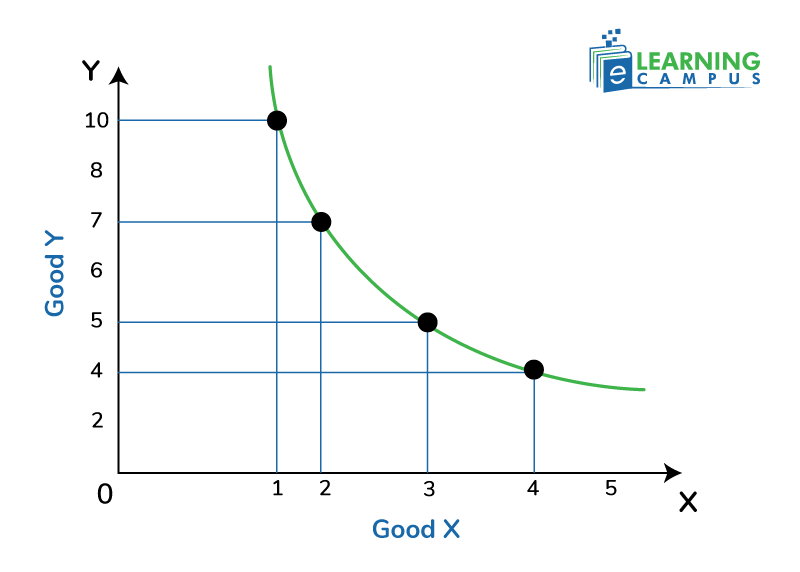
An indifference curve graphically represents all combinations of two goods that provide a consumer with the same level of satisfaction or utility. The points on the curve represent equal levels of satisfaction. It means that the consumer is indifferent to which bundle they consume. We will understand it with the help of an example. Mary consumes two goods,i.e, a sandwich and a chocolate. She consumes a different combination of these items to get an equal level of satisfaction for each combination. She is indifferent to this combination. The combination is shown in the table, and the indifference curve is shown in the graph. The graph shows that points A, B, C, D, and E provide equal satisfaction to Mary. So, Mary is indifferent to which combination of items she consumes.
How to Analyse Indifference Curve
Indifference curve analysis is a graphical way of analysing the behaviour of a consumer. It explains consumer behaviour in terms of their preferences for different combinations of two goods.
Representation
The indifference curve is represented on a two-dimensional graph. The X and Y axis represent different goods consumed. Each point on the curve represents a different bundle of goods, e.g., two goods, x and y. But all points on the same curve offer the same total utility to the consumer.
Condition
If a graph is on the indifference curve, it means that the consumer is indifferent between any of the combinations. If a consumer is indifferent between two combinations of goods, it means he has no preference for one over the other. Thus, both provide the same level of satisfaction.
Example
For example, if a consumer is indifferent between 2 pizzas and 3 cups of coffee, or 3 pizzas and 1 cup of coffee, both combinations would lie on the same indifference curve.
The slope of the indifference curve shows the marginal rate of substitution (MRS).
What is an Indifference Map
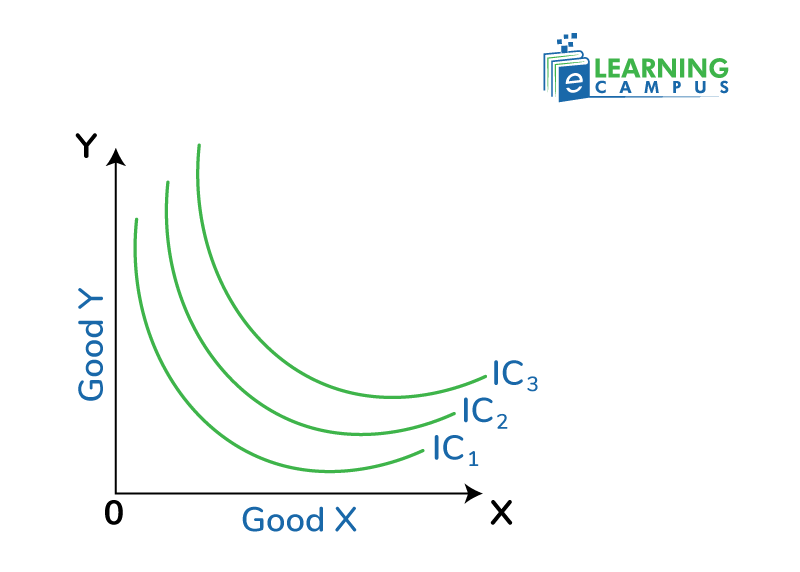
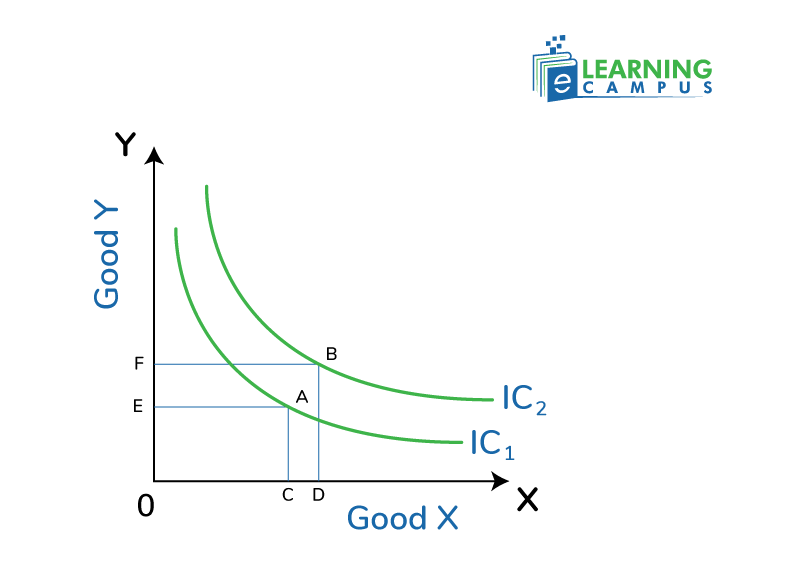
An indifference map is the representation of multiple indifference curves in a single graph. Each curve in the indifference map shows a different level of satisfaction of consumers. A higher indifference curve shows a higher level of satisfaction of the consumer for different combinations of goods. The graph below shows four different curves. Combined, they are called the indifference map.
Marginal Rate of Substitution
The marginal rate of substitution (MRS) is the amount of goods a consumer is willing to sacrifice (substitute) for another while maintaining the same level of satisfaction.
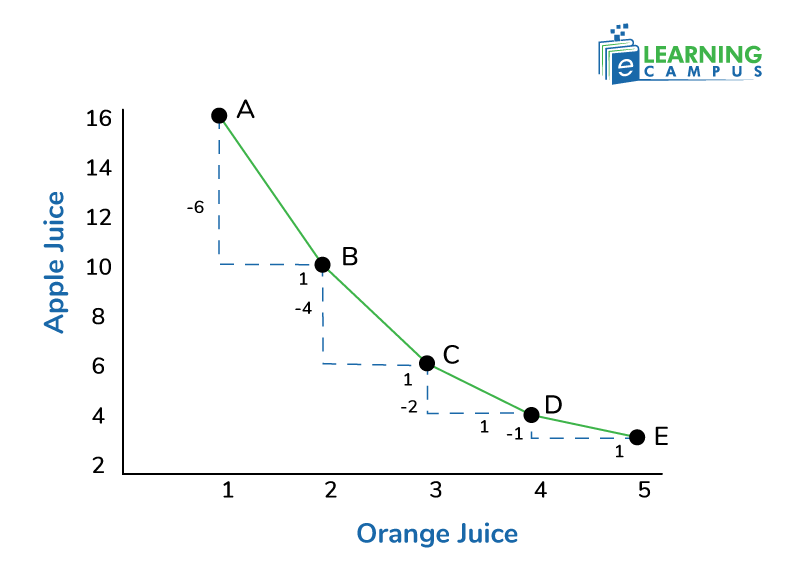
In the below graph, as the customer moves from one point to another, he substitutes one item with another.
- A to B, gives 6 apple juices to get 1 mango juice.
- D to E, gives 2 apple juices to get 1 mango juice.
The more consumers get one item, the more they will sacrifice on another. So, more apple juice means he will give up more orange juice.
The marginal rate of substitution can be calculated with the help of this formula;
Properties of Indifference Curve
Indifference curves have four key properties, including negative slope, convexity, a higher satisfaction a higher curve, and they do not intersect.
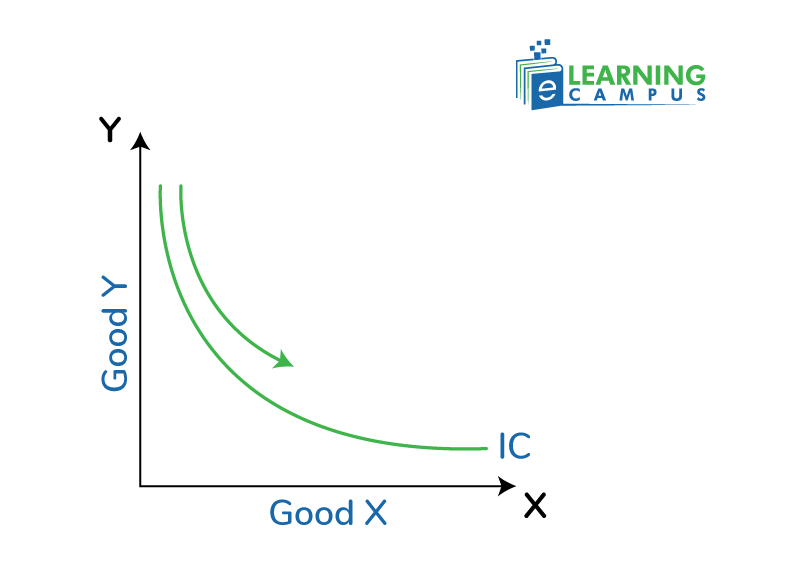
Negative Slope
An indifference curve has a negative (downward) slope. It shows that if the quantity of one commodity (y) decreases, the quantity of the other (X) increases.
Convexity
The indifference curve is convex to the point of origin. It happens due to the diminishing marginal rate of substitution of commodities. It means that consumers prefer a balanced consumption of goods rather than consuming extreme amounts of one good.
Higher Satisfaction, Higher Curve
The higher curve shows a higher level of consumer satisfaction. The curves away from the origin represent higher levels of satisfaction. The curve IC2 shows a high level of satisfaction or utility.
Non-Intersecting
Two indifference curves that show equal levels of satisfaction can not intersect. If they do, it means they show a different level of satisfaction.
What are the Exceptions of Indifference Curves
There are certain exceptions of the indifference curves. They include perfect substitutes, perfect complements, concave indifference curves, horizontal indifference curves, and U-shaped indifference curves.
Straight and Concave Curves
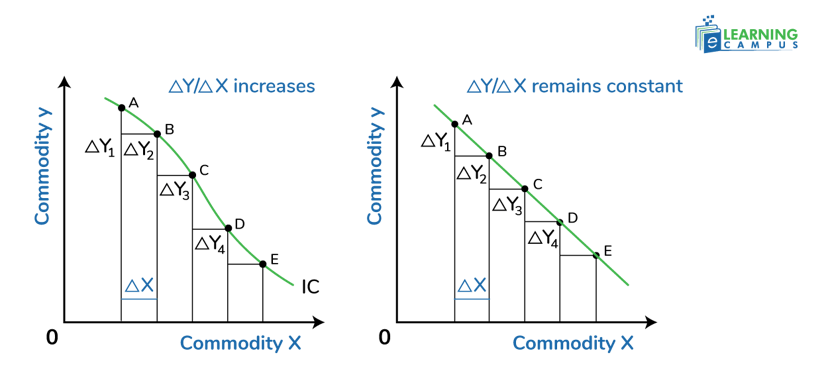
If the Marginal Rate of Substitution (MRS) of one good X or Y is constant, the indifference curve will be a straight line sloping downward. If the Marginal Rate of Substitution increases (instead of diminishing), the indifference curve will be concave.
Perfect Complement and Perfect Substitution
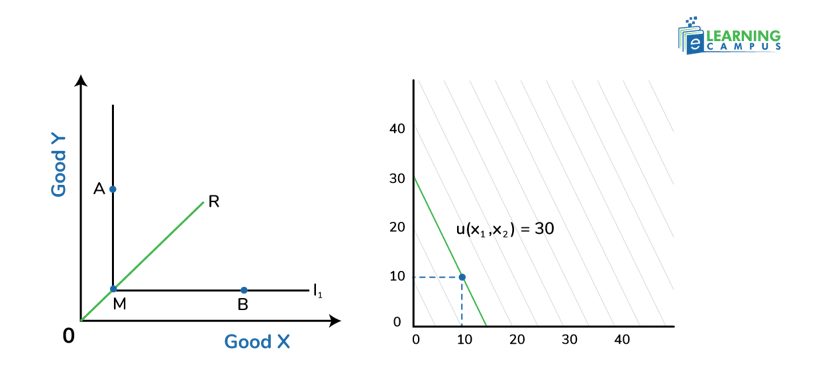
A perfect complement is the combination of goods that can not be used without each other. For example, right shoes and left shoes. One can not use left shoes without right shoes. The indifference curve for a perfect complement is L-shaped.
Perfect substitutes are the combination of two goods that can be substituted. For example, you need soda for a drink. It doesn’t matter whether you buy a two-liter bottle or two bottles of one liter. The curve for the perfect substitution is a straight line with a constant negative slope.
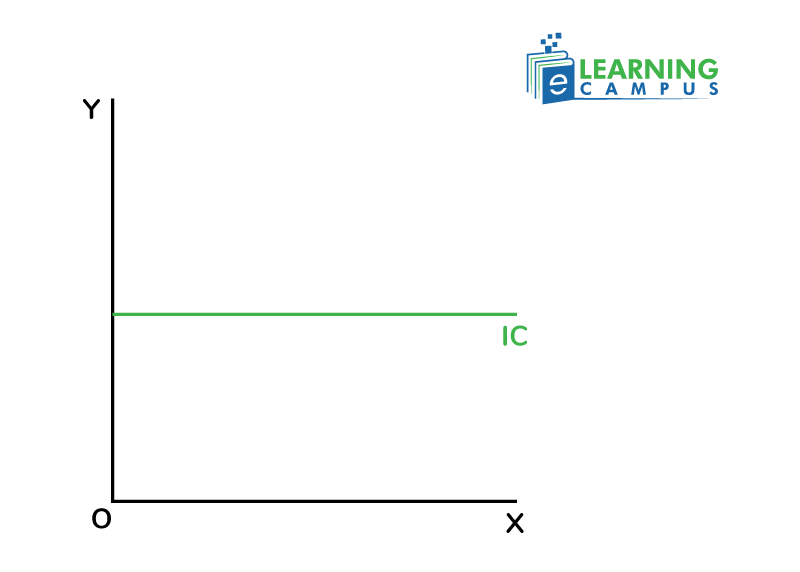
Horizontal Indifference Curve
If one good provides zero satisfaction, the indifference curve will be horizontal. It will lie parallel to the axis of the good that provides zero satisfaction. For example, the indifference curve of cigarettes for a non-smoker will be a horizontal line.
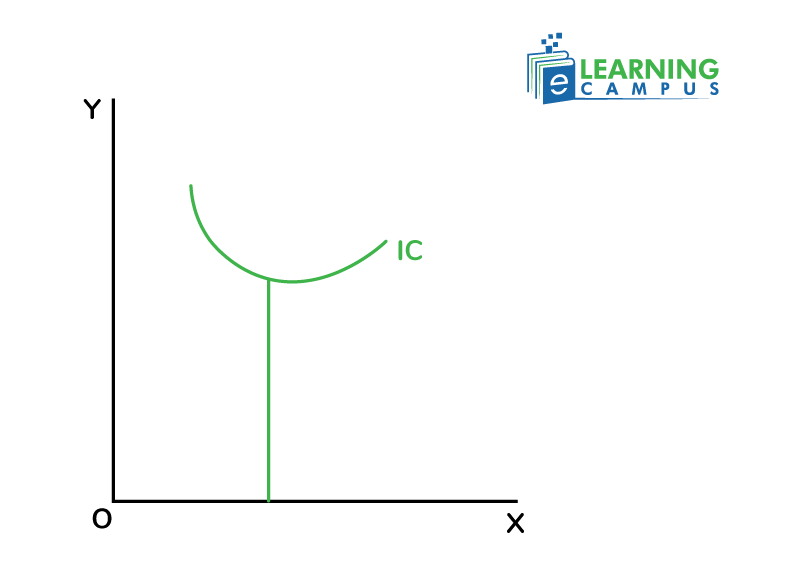
U-Shaped Indifference Curve
If the consumption of certain goods shows negative satisfaction (utility), then its curve will be U-shaped. Initially, as the consumer moves along the curve consuming more of the good, the curve slopes downward. But after the point where the good starts causing dissatisfaction, the consumer needs other goods to compensate for the negative utility of the first good. It causes the curve to bend upwards.
Conclusion
Indifference curves represent all combinations of two goods that provide a consumer with the same level of satisfaction or utility. A consumer is indifferent between any two points on the same indifference curve because they provide equal satisfaction. These curves are used to analyze the preferences and choices of consumers.
Get Online Tuition with eLearning Campus
Are you looking for online tuition for your kids? We can help you. We have expert online tutors for every subject your child needs. You will get one-on-one tutoring for subject and exam preparations.