Loading...
elearning Campus BlogOutlier Math
Outlier Math
Have you ever seen a number in a list that feels completely out of place? Although it seems strange but it is a way to present data. In mathematics and statistics, not every number fits into a pattern. Some values are much larger or lower than the rest of the data values; these values are called outliers.
Outliers can completely change the way we interpret averages, trends, or results. Are they mistakes, or do they really reveal something important?
In this blog, we provide a complete guide on what an outlier in math really is, how to find it, its types, and why it matters, with proper examples for understanding data accurately.
What is An Outlier
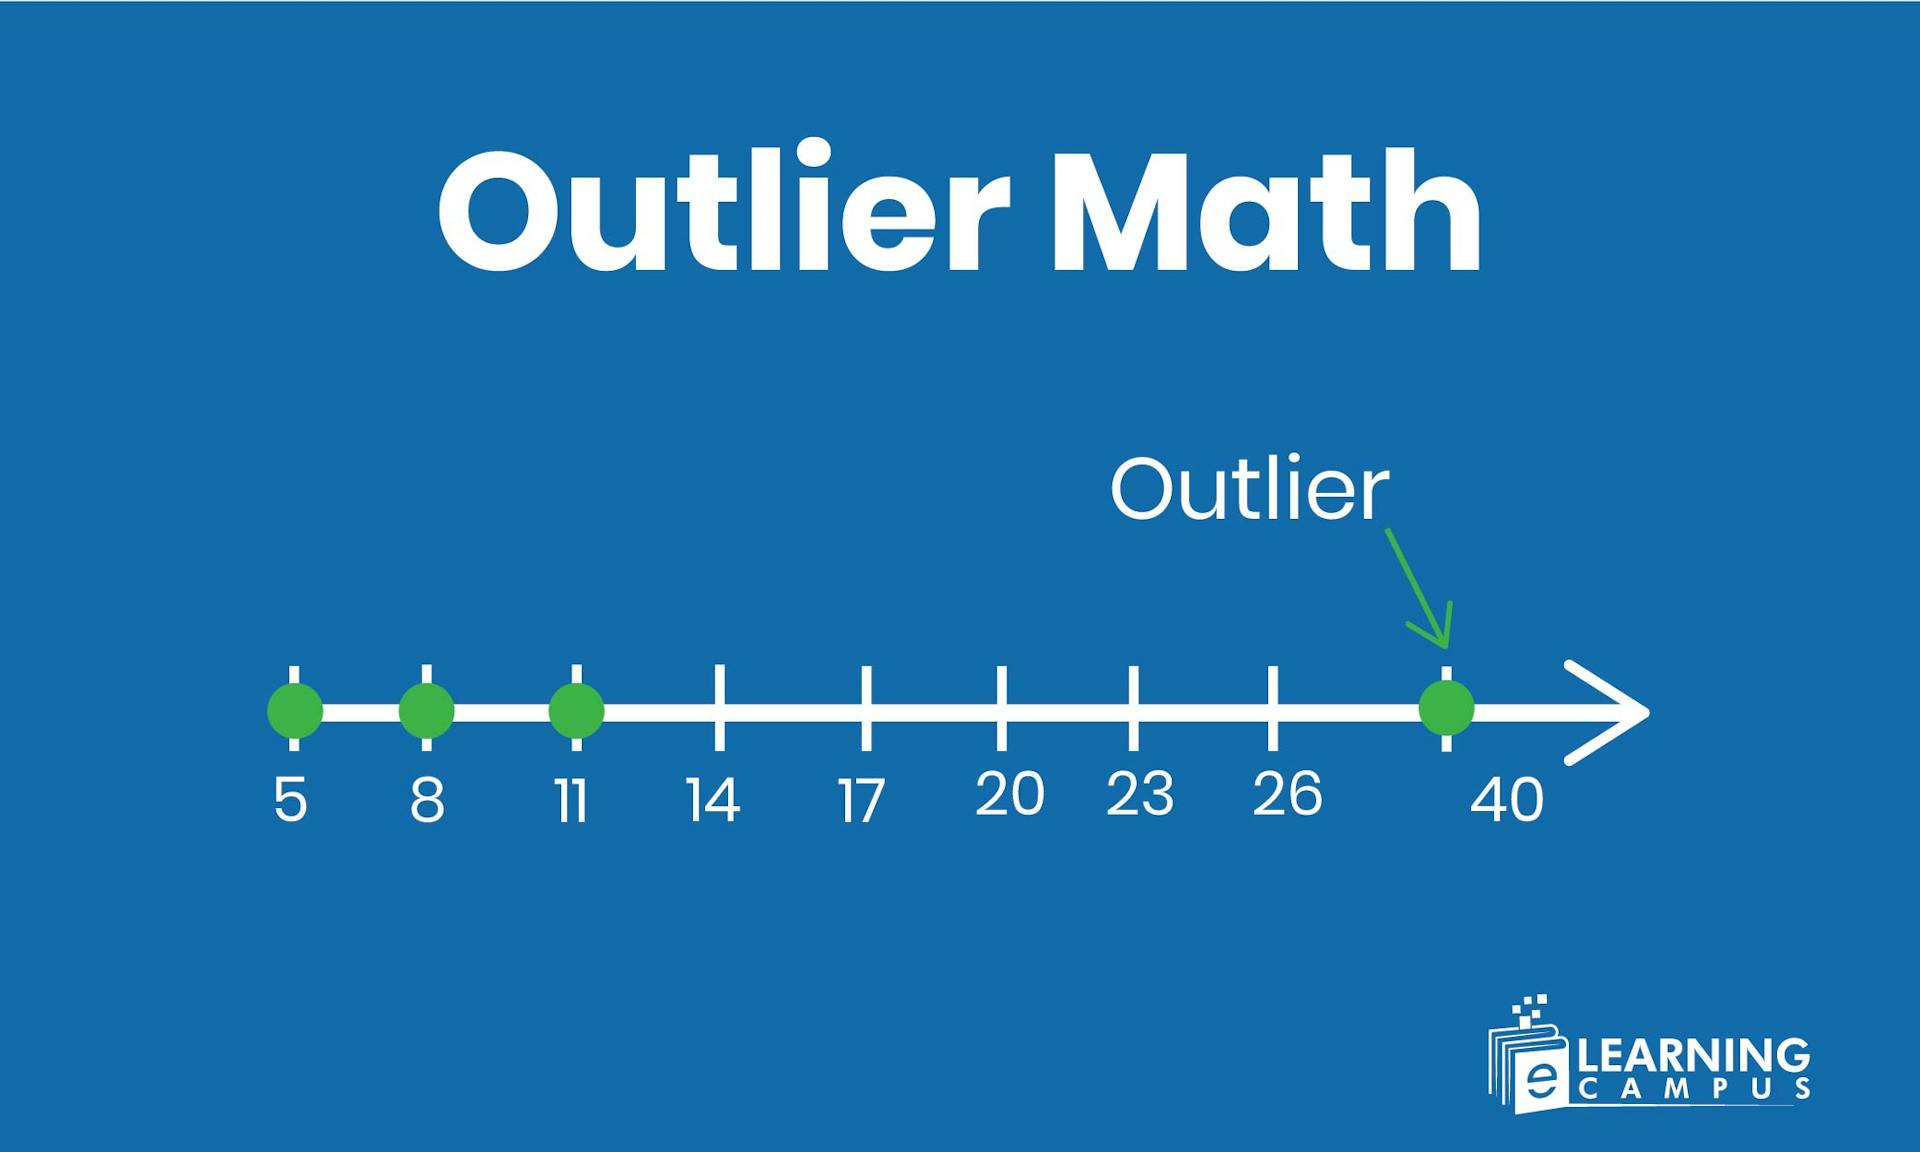
An outlier is a Data point that is significantly different from the typical range of values in a set. An outlier is always the least value or the largest value.
- For example :
Data set: 4,6,8,10,12,50
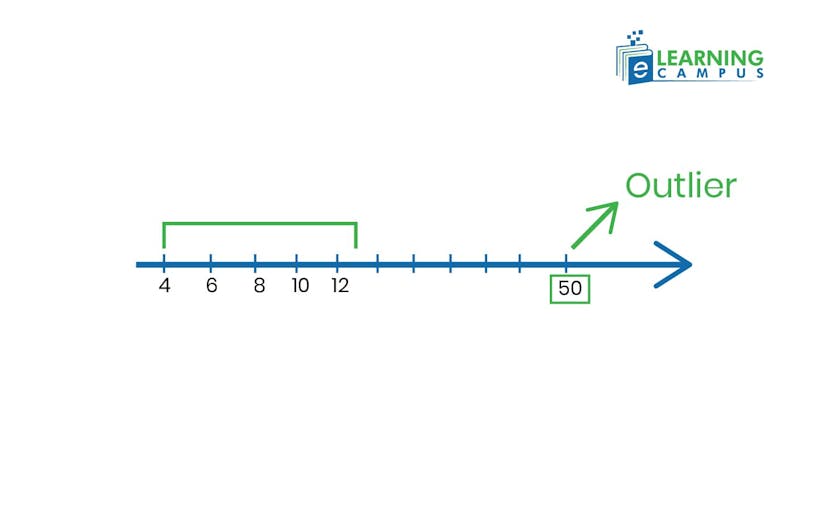
In this data set, 50 is an outlier because most of the values lie between 4 and 12, but 50 is far away. Outliers are often used in statistical methods such as the interquartile range or standard deviation.
How to Find an Outlier in Math
We can find outliers by using the interquartile range method. It is the most common method to find outliers. In this method, we need to arrange the data in ascending order, find Q1 and Q3, put Q1, Q3 in the interquartile range formula, find the boundaries, and then identify an outlier.
What is the Interquartile Range Method?
The interquartile range(IQR) is a measure of spread in a set of data. It tells us how widely the 50 % of values are spread out. It focuses on:
- Middle 50 % of the data
- It ignores outliers (extremely high or low values )
Formula of IQR=Quartile 3- Quartile 1
What are Quartiles?
Quartiles divide a data set into four equal parts after arranging the data into ascending order.
- Q1(First quartile) =25% of datal=lower data
- Q2 (second quartile) =50% of data =median (middle of data)
- Q3 (third quartile) =75% of data=upper middle
- Q4(fourth quartile)=100%=Highest data
How to Find Quartiles?
To find out quartiles, you need to arrange the data in ascending order, find Q2, which is the median, find Q1, which is the lower half of the median, then find Q3, which is the upper half of the median.Q4 is the last quartile range, so it has the Maximum value from the dataset. Steps are given below :
Step 01: Arrange the data in ascending order
Suppose the data set :
4,3,6,10,8,12
Arrange it: 3,4,6,8,10,12
Step 02:Find Q2(Median)
Median means the middle value
Q2 is 7
Step 03: Find Q1, which is the median of the lower half data
Lower half =3,4,6
Its median is 4
Q1 is 4
Step 04: Find Q3, which is the median of the upper half
Upper half=8,10,12
Median =10
Q3 is 10
Note: Q4 is not determined separately, as we calculate Q1, Q2, and Q3, because it is the last quartile range. We can say that it is from Q3 to the highest value, so Q4 is are value lying between 10 and 12
Steps to Find Outliers
Outliers can change averages, affect graphs, and sometimes reveal secret patterns in data. Here, the interquartile method helps them accurately. Steps are:
- Step 01: Arrange the data
First step is to arrange the data in ascending order (from lower to higher value).
- Step 02: Find Q1 and Q3
For the calculation of Q1 and Q3 (Q1 is the first quartile and Q3 is the third quartile), Q1 median lower half data, and Q3 is the median of the upper half of the data, as we discussed above.
- Step 03: Calculate the Interquartile range
You can find the interquartile range by simply putting the values of Q3 and Q1 in this formula:
Calculate IQR by using the formula :
IQR=Q3-Q1
- Step 04: Find boundaries
Find the boundaries by using the formula :
Lower limit=Q1-1.5IQR
Upper limit =Q3+1.5IQR
- Step 05:Identify an Outlier
Any value below the lower limit or above the upper limit is an outlier.
Why are Outliers Important in Maths
Outliers are not just random values that matter because they affect how we understand data. Here’s why they are important
- Changing the averages by one extreme value can make the average misleading
- They can hide or exaggerate patterns.
- Sometimes an outlier shows a unique or rare event.
- They can expose data errors. A very large or small value may be due to incorrect data.
What Are the Types of Outliers
There are five main types of outliers. They can vary depending on how far from the start of the data and why they occur.
1. Mild outliers
These are the values that are just outside the normal range. They fall between 15IQR and 3IQR beyond Q1 or Q3.
- For example :
If most data points are between 10-20, and you get a 25, it is a mild outlier.
2. Extreme outliers
Extreme Outliers are far beyond the rest of the data. They lie more than 31IQR beyond the quartiles.
- For example :
In test scores of 40-90, a score of 150 would be an extreme outlier
3. High outliers
These are the data points much larger than the others
For example, most of the students score around 60-80, and a score of 100 is a high outlier.
4. Lower outliers
These are the data points much smaller than the others
- For example:
If most of the temperatures are 25°C to 30°C, and one day it is 10°C, which is a lower outlier.
5. Contextual or Conditional outliers
A value that seems normal in one situation but abnormal in another context is called a contextual or conditional outlier.
- For example
A temperature of 30°C is normal in summer but an outlier in winter.
Do Outliers Always Change the Mean and Median?
Outliers have always impact on the mean, but it does not affect the median.
Outliers have a great impact on the Mean because they use the whole data in calculations, so too large or lower a value changes the overall results.
While in median, the case is different because it uses only the middle values, so it does not affect or slightly affects.
Here are the examples that will show how outliers affect the mean and median:
Effect of Outliers on Mean(Average)
The mean is highly sensitive to outliers because it uses all numbers in the dataset. If one extreme high or low value can pull the means toward it and change the average value
For example, data 10,12,14,16 without outlier
Now with outlier 70
Data =10,12,14,16,70
Here, you can see that the mean jumped from 10.4 to 24.4 because the outlier is very large and pulls the mean upward.
Effect of Outlier on Median (Middle value)
The median lies only on the middle value of the ordered data, so an extreme value does not have a greater effect on it.
For example: 10,12,14,16,70
Median =14
Although 70 is a large outlier, it does not affect the median.
Conclusions
Outliers are the numbers that do not fit in your data patterns. It can either have too large or too small values. It can affect the means as it changes the whole result, but has a minor effect on the median because it only uses the middle value. Outliers help in your analysis to spot errors, special cases, and important insights in the database. In our blog, we provide a simple IQR method that helps you to understand outliers through a formula.
Learn math online with expert tutors.
Do you find it hard to understand which numbers are outliers and how to detect them? Don't worry, our expert online math tutors are here to help you. Explore more easy math guides and strengthen your concepts step by step. Get benefits with our online tutoring service and start easily learning math.
