Loading...
elearning Campus BlogVenn Diagram
Venn Diagram

You may have seen two or three overlapping circles in Mathematics. Do you know what they are? They represent the Venn diagram. You may be curious about the purpose of a Venn diagram. They are used to visualize the logical relation between sets.
In this blog, you will learn about what Venn diagram is and how to represent sets in it.
What is a Venn Diagram
A Venn diagram illustrates the logical relationship of two or more sets of items with the help of overlapping circles. The overlapping part of the circles shows the elements of the data with a common trait. Circles with no overlapping have no commonality.
The Ven diagram was popularized by John Venn in 1880.
How to Draw a Venn Diagram
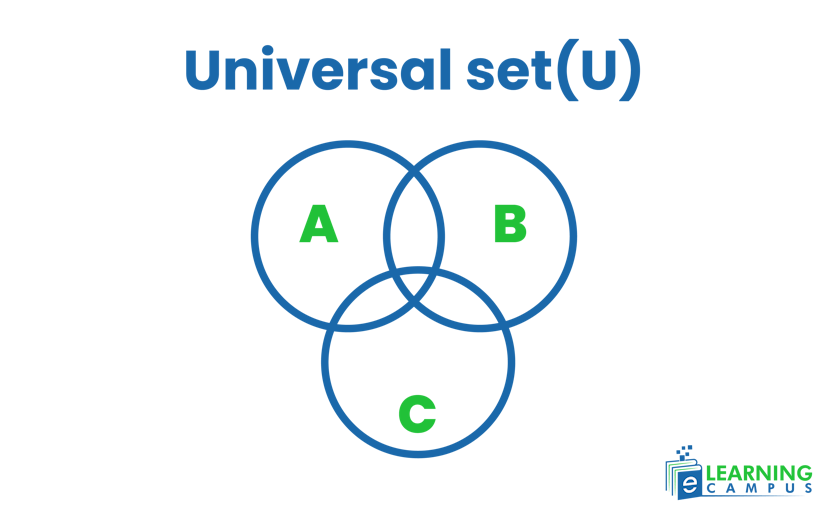
A Vann diagram is drawn with the help of simple circles on a plan. They usually comprise 3 or more than three overlapping circles. The inner circle represents the elements of a set, and the external circle shows the elements that are not elements of the set. The following steps are involved while drawing the Vinn diagram;
- With the help of a rectangle, show the universal set.
- Draw a circle representing different sets.
- According to the number and relation of the set, overlap accordingly.
- Find the commonality and union among sets with the given condition.
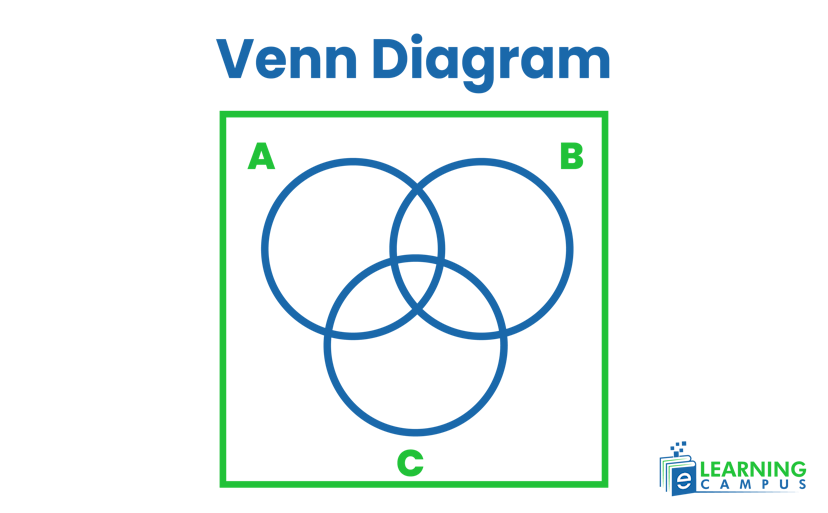
- For a given set A, B, and C, the relation on a Venndiagram is represented as;
Venn Diagrams of Sets
Venndiagrams represent sets and the relationships among them visually. To illustrate this, we have to show the sets in circles within a rectangle that represents the universal set. The set operations like union, intersection, and difference are represented in it. We can represent the Venn diagrams with three sets or any number of sets.
Here, we will perform some basic operations on set and represent them in the venndiagram.
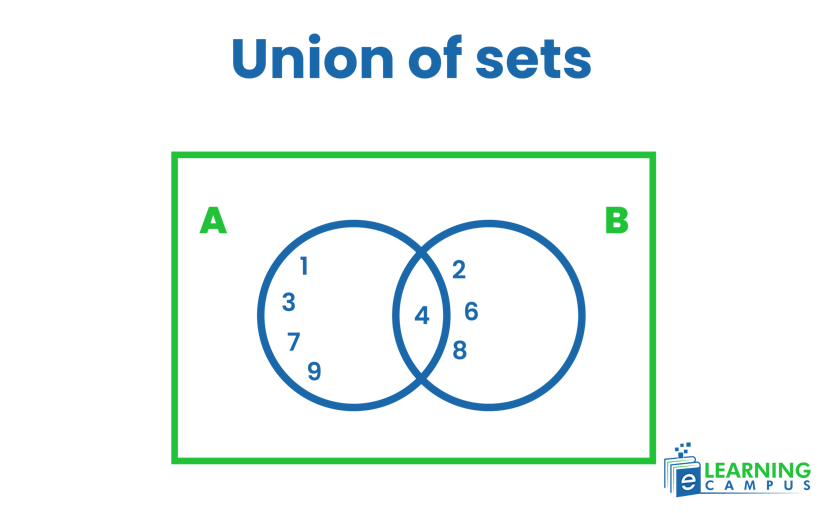
Venn Diagram of Union of Sets
The union of sets is the set that contains all elements in both sets.
For example, set A has elements 1, 3, 4, 7, and 9, and set B has elements 2, 4, 6, and 8.
The union of the set will be
The union of sets on the Vinn diagram can be represented as
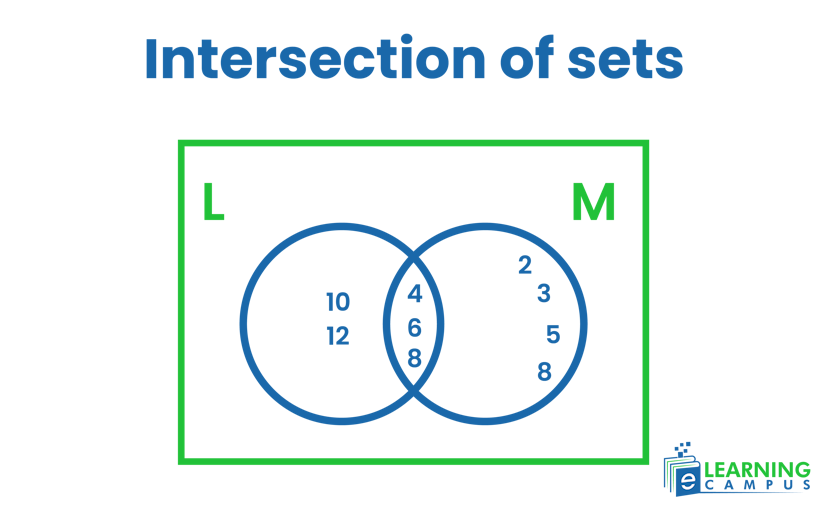
Intersection of Set Venn’s Diagram
The intersection of any set is the set that contains elements that are present in both sets, i.e., common in both sets.
For example, if
The intersection of sets will be given as;
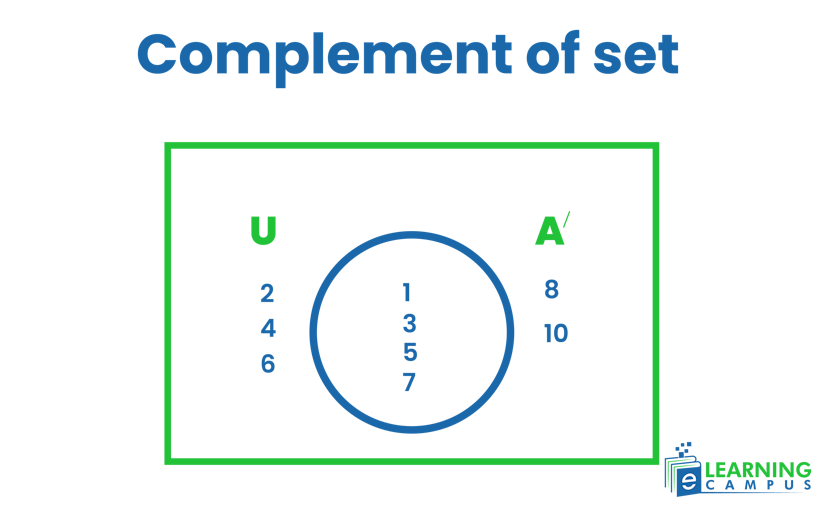
Venn Diagrem for Compliment of Set
The complement of a set A is the set of all elements in the universal set (U) that are not in set A. It is denoted as A'.
For example,
universal set U= {1, 2, 3, 4, 5, ...}
Difference of Sets Venn Diagrm
The difference of any two sets, say A and B, denoted by A - B, is the set containing all elements that are in set A but not in set B.
For example,
The difference of sets is represented as;
Types of Venn Diagrams
We can easily represent any set on Venn Digarm. Based on the representation of the numbers of sets, they are categorized into different types. Let’s discuss the types of Venn diagrams.
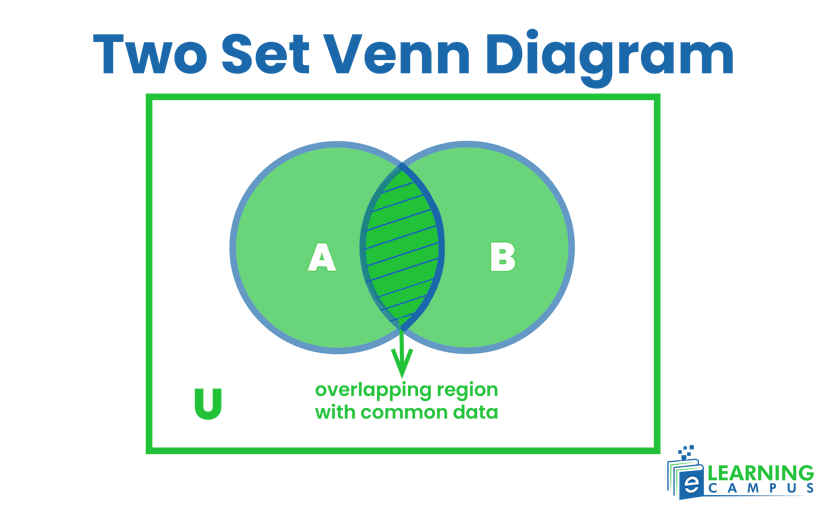
Two Set Venn Diegram
The two-set Venn diagrm represents the logical relationship between two sets with different elements or data. It is represented by two overlapping circles.
The below diagram with overlapping circles shows the Vann diagram of two sets A and B.
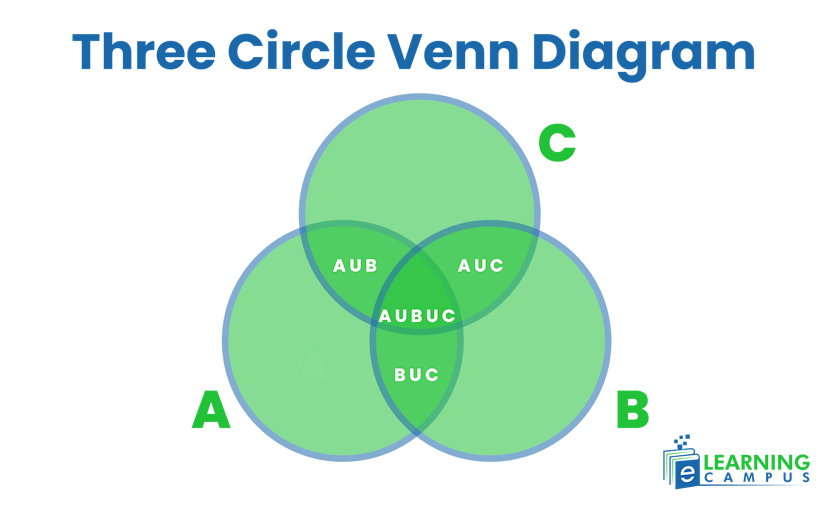
Three Circle Venn Diagram
We represent sets on a Venn diagrom with the help of circles. The three circle Venn diagram represents the elements of three different sets.
Let’s understand the three set Venn diagram with the help of examples.
Suppose we have three sets A, B, and C.
Set A represents the boys who can play Baseball, soccer, and softball.
Set B represents Basketball, soccer, and softball.
Set C represents Soccer and swimming.
Three overlapping circles below shows the relationship between the three sets.
The Vann diagram of A ∪ B depicts {Baseball, Soccer, Softball, and Basketball}
Venn diaggram of for A ∪ B ∪ C has {Baseball, Soccer, Softball, Basketball, and Swimming}
The Venn’s diagram for A ∩ C has {soccer}
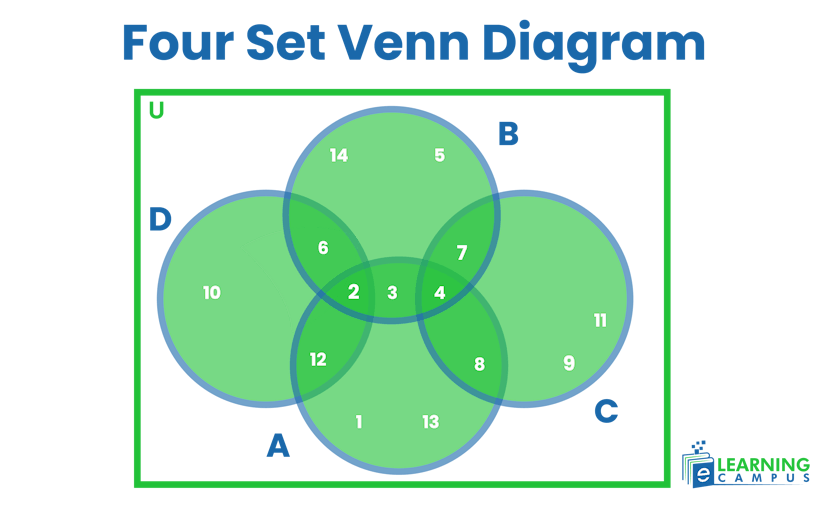
Four Set Ven Diagram
The venn digram for four four-set is complicated than the 2-set and 3 set venn diagram. We will look at the Venn diagram 4 sets examples to understand it well.
Consider, we have four sets, i.e,
The relationship between these four sets can be represented as;
Solved Example of a Venn Diagram
Let’s look at the solved example of Venn diagram.
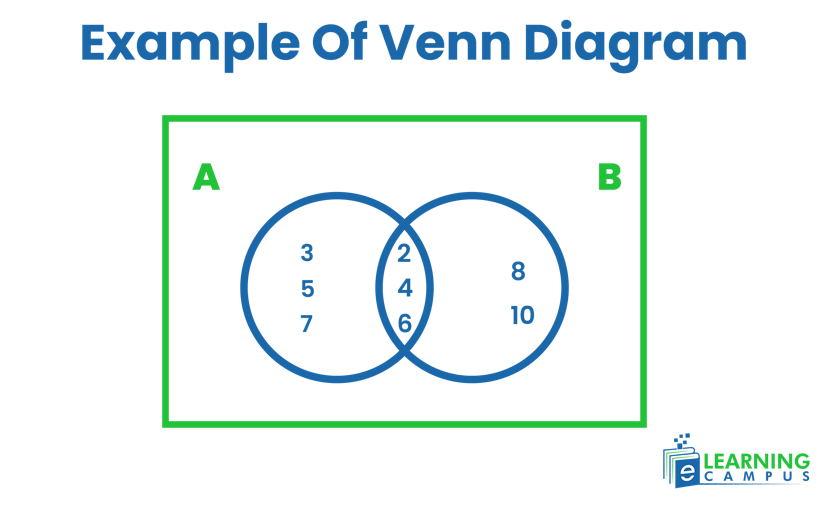
Example 1:
Two sets are given, A={2,3,4,5,6,7} and B={2,4,6,8,10}. Show the intersection of sets on the ven diagram.
First, we will find the intersection of sets.
Now, we will show it on diagram.
Learn Math with an Expert Tutor
Are you in search of an expert online Math tutor? We help you find one. The eLearning campus has expert Math teachers to instill in your kids a love for Math.