Loading...
elearning Campus BlogWhat Are the Different Types of Slope
What Are the Different Types of Slope
Have you ever seen the lines in a graph that are directed differently? You may think what these lines represent. At first, they seem challenging for students until they learn about different types of slopes.
If you are also confused about these lines, this blog can help you understand slope types in mathematics. We will explain everything from positive slopes, negative slopes to zero and undefined slopes.
What Does the Slope Represent in Math
In mathematical terms, slope is the measurement of the steepness of a line. It is not just an abstract mathematical concept. It is a fundamental way to understand real-world situations.
The slope represents the rate of change, direction, stability, and verticality.
- Rate of Change: A positive slope indicates a value is increasing as another increases, much like earning more money over time.
- Direction: A negative slope shows a value is decreasing, such as the decline in temperature as a day progresses.
- Stability: A horizontal line with a zero slope represents constant conditions, like a flat, stable path.
- Verticality: An undefined slope describes something that changes without moving sideways, like a wall.
Different Types of Slopes
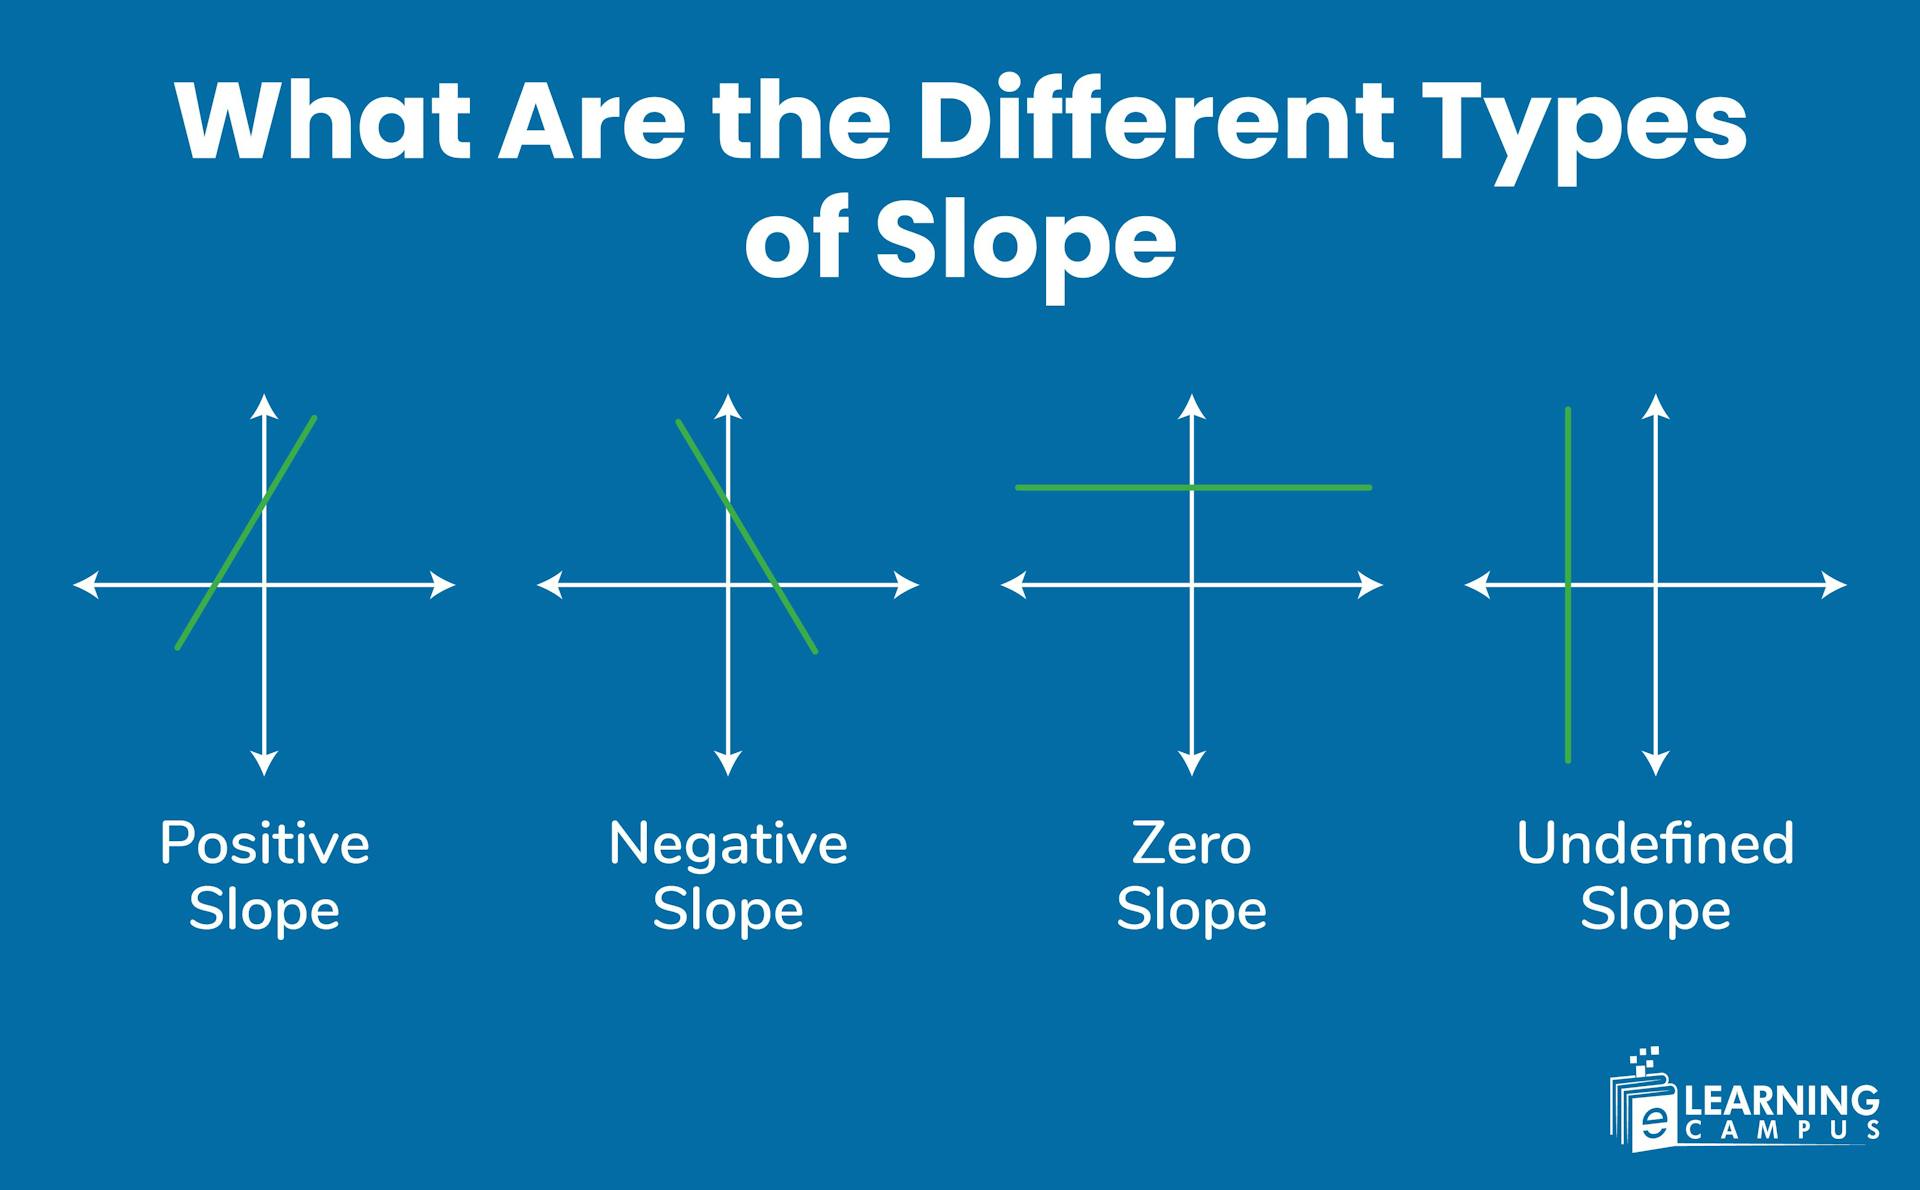
In mathematics, slope measures the steepness and direction of a line, indicating the rate of change between two variables. There are four types of slope, distinguished by the direction of the line on a graph when viewed from left to right.
The main types of slope include positive slope, negative slope, zero slope, and undefined slope.
Positive Slope
A positive slope represents a line on a coordinate plane that rises from left to right. It shows that as the independent variable on the x-axis increases, the dependent variable on the y-axis also increases at a constant rate.
A positive slope can be identified by observing that the line goes up from left to right, or by confirming that the calculated slope (the ratio of vertical change to horizontal change) yields a positive number.

Graph of Positive Slope
A graph with a positive slope is a straight line that rises from left to right.
To illustrate the concept of a positive slope, let’s create a graph showing a line with a positive slope, where the y-axis value increases as the x-axis value increases. The graph will represent a direct relationship between two variables, such as time (x-axis) and distance (y-axis), for an object moving at a constant speed.
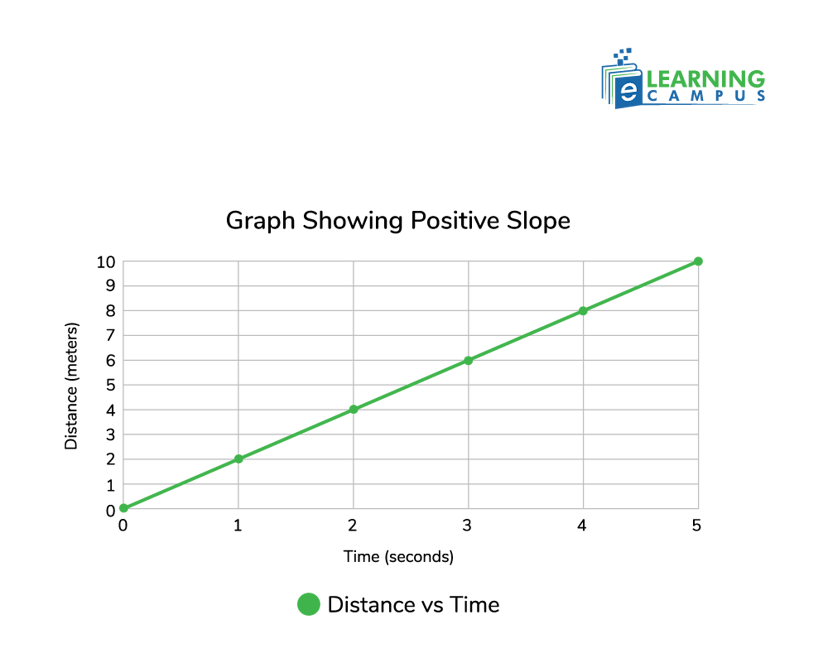
This chart displays a line with a positive slope, where the distance (y-axis) increases as time (x-axis) increases. The line rises from left to right, forming an acute angle with the positive x-axis in the counterclockwise direction, as the slope is positive. Here, the slope is 2, as the distance increases by 2 meters per second.
- Read the line from left to right. A line with a positive slope will move upward as you move your eyes to the right. Think of it as walking uphill.
How to Find a Positive Slope
A positive graph can be calculated from a graph, two points, or an equation.
From a graph (visual method)
If you can see the graphed line, follow these steps to find its slope:
- Read the line from left to right. A line with a positive slope will move upward as you move your eyes to the right.
- Pick two distinct points on the line, preferably where the line crosses the grid at whole-number coordinates.
- Determine the rise and the run between the two points. Count the vertical distance needed to move from the lower point to the upper point. Since the line is going up, this value is positive.
- Count the horizontal distance to move from the lower point to the upper point. Since you are moving to the right, this value is also positive.
- Calculate the slope using the formula
- If both the rise and run are positive, the result will be a positive slope.
From Two Points (using a formula)
If the coordinates of two points on a line are given, i.e,
we can calculate the slope using the formula;
Example: Find the slope between the points (2, 5) and (9, 19)
Put the value in the formula to find the positive slope.
The slope is 2, a positive integer. It shows that the slope is positive.
From an equation
If the linear equation is in slope-intercept form (y=mx+b), the slope is represented by the variable m.
Example: In the equation
the slope is 4. Since 4 is a positive number, the line has a positive slope.
Real-World Examples of Positive Slope
A positive slope has several uses in our daily lives. Here are some of the real-world examples.
- Worker Earnings: The relationship between a worker's hours and their earnings often shows a positive slope. More hours worked lead to higher earnings.
- Advertising and Sales: A company's advertising budget and its sales revenue can have a positive slope. Increased spending on advertising might result in higher sales.
- Study Time and Scores: The time a student spends studying and their exam scores can be modeled with a positive slope, as more study time generally leads to better scores.
Negative Slope
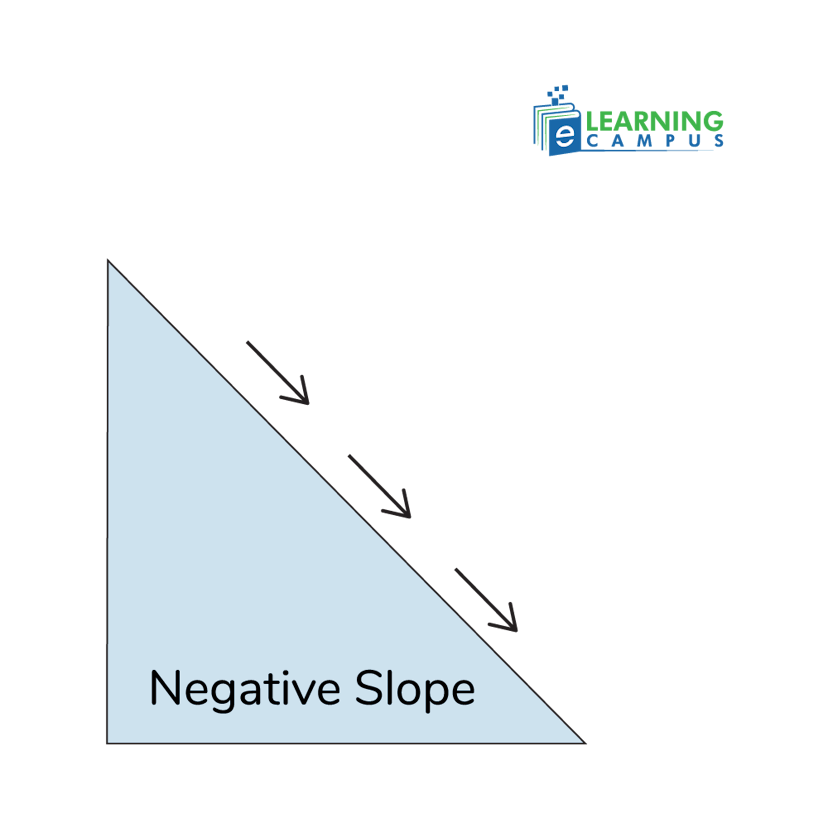
A negative slope shows a line that moves downward from left to right on a graph. It represents an inverse relationship between two variables. It means that as one variable increases, the other decreases.
Graph of Negative Slope
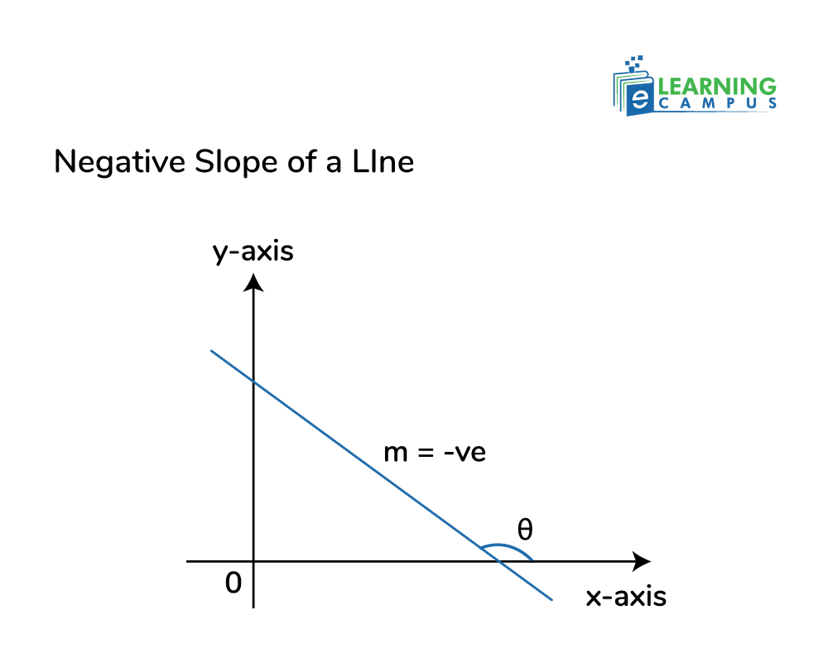
The graph of a negative slope represents the inverse relation between variables. The variables are represented graphically along the x-axis and the y-axis. The line is drawn to show the relationship between quantities.
As the value of the x-axis increases, the value of the y-axis decreases. This inverse relationship is represented by the negative slope of the line.
The negative slope line makes an obtuse angle with the positive x-axis.
How to Find a Negative Slope
A negative slope can be calculated through a graph, using two points, or by analyzing a linear equation. If the calculation results in a negative number, the slope is negative.
Calculating from Graph
To find a negative slope on a graph, look for a line that descends or goes down as you read the graph from left to right. A negative slope also occurs when the change in y (rise) is negative and the change in x (run) is positive, showing that y decreases as x increases.
- Look at the direction of the line from the left side of the graph to the right side. If the line goes downhill (like descending stairs or a downward slope), it has a negative slope.
From Two Points
If the coordinates of two points on a line are given, we can find the negative slope by using the slope formula:
Example
Find the slope of the line passing through the points (4, 2) and
(-4, 8).
- Find the points (x1, y1) = (4, 2) and (x2, y2) = (-4, 8)
- Put the values in the formula
‘m’ is negative. So, the slope is negative.
From a Linear Equation
If you have the equation of a line in slope-intercept form, y=mx+b, the slope is the coefficient of 𝑥 (the value of m). If it is negative, the slope is negative.
Example
For the equation, y=−53x−2y, the slope (𝑚) is −53. Which is a negative slope
Real-world Examples of Negative Slope
- Price and demand: As the price of a product increases, the quantity demanded by consumers generally decreases.
- Water draining from a pool: As time passes, the amount of water remaining in a pool decreases.
- Altitude and air pressure: As your altitude increases, the air pressure decreases.
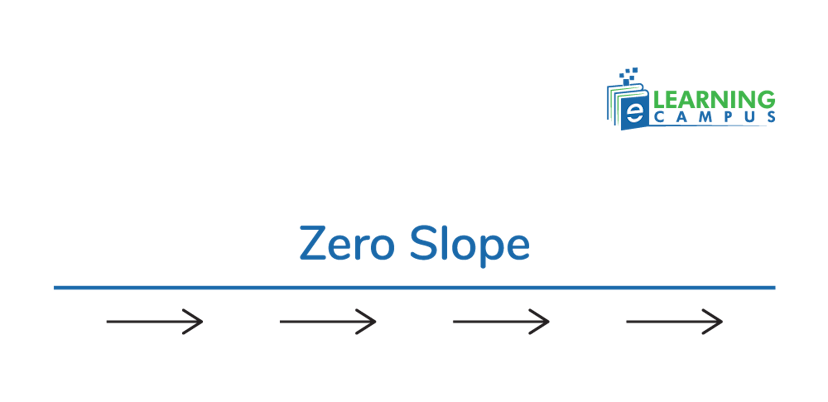
Zero Slope
A zero slope represents a perfectly horizontal, flat line on a graph. It describes that there is no steepness or change in the y-coordinate. The equation for such a line is always in the form y = c. where 'c' is a constant real number, because every point on the line shares the same y-value.
Why is it Called Zero Slope
A zero slope means the line moves from left to right, parallel to the x-axis. There is no change in the y-axis. The value of the change in the y-axis is zero, i.e,
When we put the values in the formula, zero divided by any value is zero.
Example
Find the slope of any two points on this line: (1, 3) and (5, 3).
Put the values in the formula
How to Identify Zero Slope
- Look at the Equation. If an equation is written as y = c, it has a zero slope.
- Use the Slope Formula: Choose any two points on the line.
- Calculate the difference in y-coordinates
$$ (y_2 - y_1) $$
- Calculate the difference in x-coordinates
- The slope
will be zero if (y2 - y1) is zero.
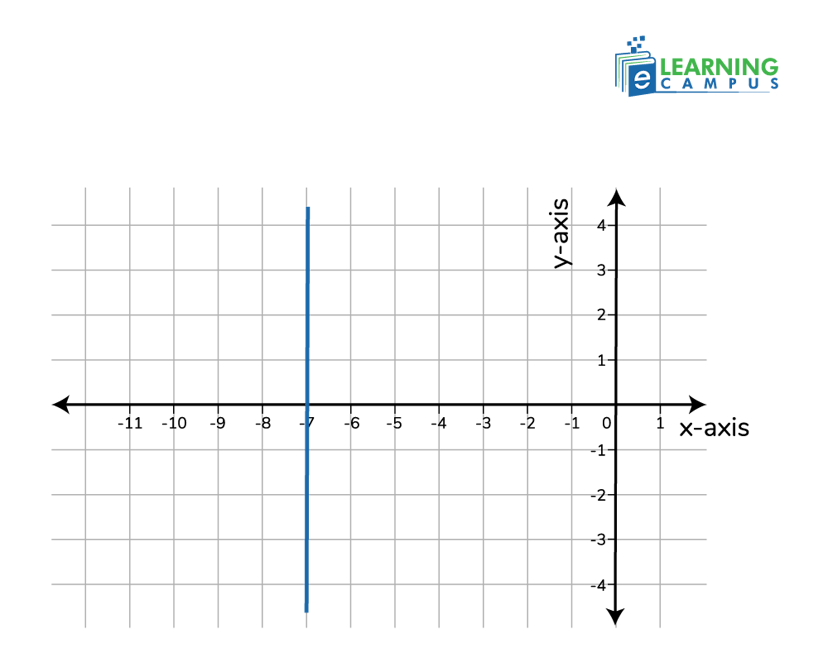
Undefined Slope
An undefined slope represents perfectly vertical lines. The slope of any straight line that is parallel to the y-axis is undefined. Because tan 90° is undefined. An undefined slope is also known as an infinite slope.
Why is it Undefined?
- Slope Formula: Slope is calculated as the rise (change in y) divided by the run (change in x).
- No Horizontal Movement: For a vertical line, there is a change in the y-coordinate but no change in the x-coordinate (the run is zero).
- Division by Zero: Since the denominator (run) is zero, the slope becomes undefined, as division by zero is mathematically undefined.
Characteristics of a Line with an Undefined Slope
- Vertical Orientation: The line goes straight up and down, parallel to the y-axis.
- Zero Horizontal Change: There is no run or horizontal movement between any two points on the line. It means the change in x is zero.
- Non-zero Vertical Change: There is a vertical distance between points, but this cannot be measured in terms of steepness using the slope formula.
- Undefined Slope Formula: The slope formula (m = (y₂ - y₁) / (x₂ - x₁)) results in a division by zero, e.g., 3/0, making the slope undefined.
- Constant x-coordinate: All points on the line have the same x-coordinate.
- Equation form: The equation of a vertical line is written in the form x = a, where 'a' is the constant x-coordinate of all points on the line.
- Perpendicular to the x-axis: A vertical line is perpendicular to the x-axis.
Differences Between Zero Slope and Undefined Slope
The key differences between zero slope and undefined slope relate to the direction and nature of the lines they describe:
Zero Slope
- Occurs in horizontal lines
- The line runs parallel to the x-axis
- As we move along the line, the y-coordinate stays constant while the x changes
- Mathematical form: y = c (where c is a constant)
- Example: y = 3, y = -2, y = 0
- Calculated as: slope = (y₂ - y₁)/(x₂ - x₁) = 0/(some non-zero number) = 0
- The line has no vertical change (rise = 0)
Undefined Slope
- Occurs in vertical lines
- The line runs parallel to the y-axis
- As you move along the line, the x-coordinate stays constant while y changes
- Mathematical form: x = c (where c is a constant)
- Example: x = 5, x = -1, x = 0
- Calculated as: slope = (y₂ - y₁)/(x₂ - x₁) = (some non-zero number)/0 = undefined
- The line has no horizontal change (run = 0), and dividing by zero occurs.
Visual Summary
- Zero slope = horizontal line (flat)
- Undefined slope = vertical line (straight up and down)
The fundamental difference is that a zero slope represents a measurable rate of change (zero change in y per unit change in x), while an undefined slope represents an impossible calculation due to division by zero, which occurs when there's no change in x-coordinates between any two points on the line.
Conclusion
The different types of slope are positive, negative, zero, and undefined, categorized by their steepness and direction on a graph. A positive slope rises from left to right, a negative slope falls from left to right, a zero slope is a horizontal line, and an undefined slope is a vertical line. These classifications help in understanding the relationship between two variables, often represented by an x-axis and a y-axis on a graph
Transform Your Math Skills with Expert Online Tutoring
Struggling with equations, calculus, or geometry? Our certified math tutors provide personalized one-on-one instruction tailored to your learning style, helping you build confidence and improve grades fast. With flexible scheduling and interactive online sessions, you will master math concepts that once seemed impossible.