Loading...
elearning Campus BlogFinding Mean, Median, Mode, and Range
Finding Mean, Median, Mode, and Range
Data calculation plays an important role in statistics and our daily lives. We come across the data in one way or another in our daily routine. Mean, Median, Mode, and Range make data calculations easy by providing a single common value for a large set of data.
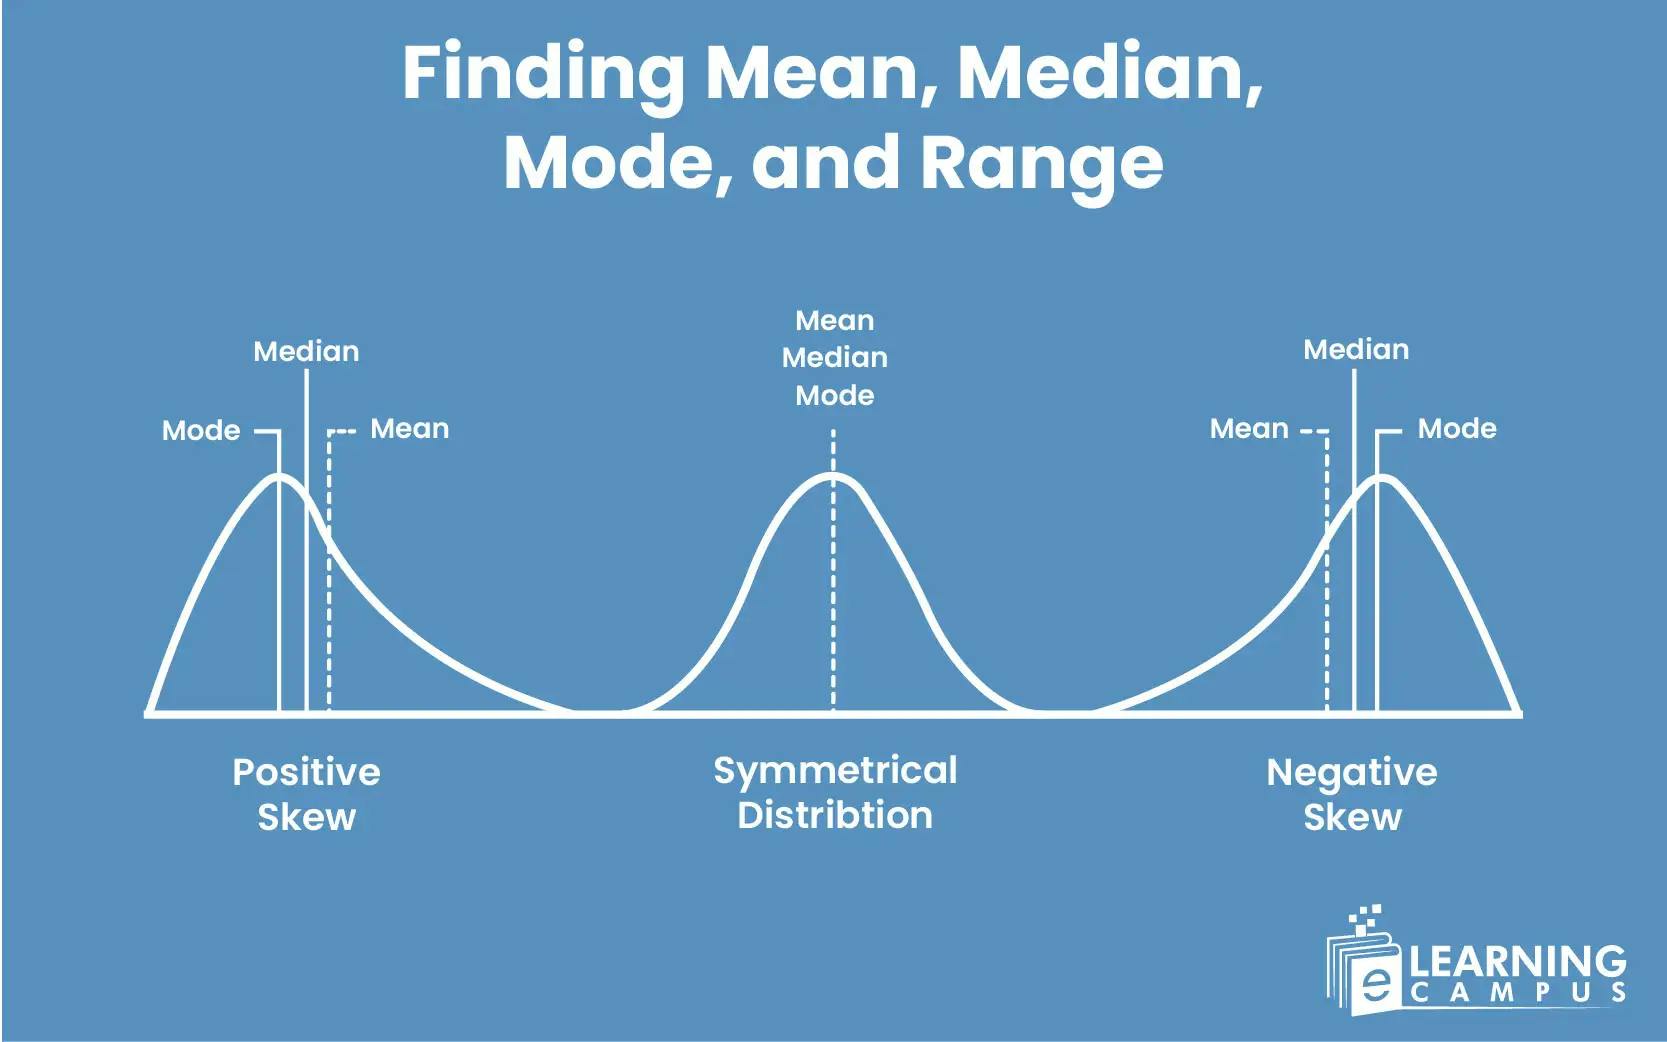
The mean median and mode are all measures of the central tendency of the data, and the range is known as the measure of dispersion.
Let’s learn what the central tendency is and how it is measured through Mean, median, and mode.
Central Tendency
The central tendency is the identification of a single value that represents the distribution of the entire data. The central tendency of data can easily be found through mean, median, and mode.
Let’s learn these measures in detail one by one.
Mean
Mean, also known as the Arithmetic mean, is the given data's average value. This is the first measure of the central tendency. Mean is achieved by adding all the numbers in a data set and dividing them by the number of values.
Mean Formula
The general formula of the Mean is;
Where n represents the sum of all the values in a given data x and n represents the total number of data. The formula in simple form can be written as;
Example:
Consider we have numbers 12, 2, 40, 18, 8, 10. To find the mean of these numbers, first, we will add all the numbers and divide by the number of values. By following the standard formula.
In this example, the sum of all numbers n is 90, and the total numbers n are 6.
So, by dividing 90 by 6, we get 15, which is the mean of 12, 2, 40, 18, 8, and 10.
Median
The median falls second in the measures of the central tendency. It is the number that lies in the middle of any data set.
How to Find Median
To find the median, we arrange the numbers in ascending order and see which number is in the middle of the data. However, the method to find the median of data with an even number will be different from the dataset containing an odd number.
- In the data set with the odd number of values, the median will be the number that lies in the middle.
The formula to find the median of the odd number of observations is
Where n represents the number of observations.
- For the data set with an even number of values, the average of two middle numbers will be called the median. The average can be calculated by using
- Where n and m represent two middle numbers.
Example:
We have numbers 13, 9, 15, 8, 11, 7, 2, 5, 12.
To find the median, first, we will rearrange the numbers in ascending order.
2, 5, 7, 8, 9,11, 12, 13, 15.
The numbers are odd. So, we will use the below formula to find the median.
The number of observations is 9. We will replace n with nine and calculate the value.
So, the fifth number is the median, which is 9.
For the above-given data, the median is 9.
Let's consider another set of data: 5, 8, 9, 1, 6, 10, 3, 11.
On rearranging the numbers in ascending order, we get 1, 3, 5, 6, 8, 9, 10, 11.
The observation numbers are even. So, the median will be the average of two numbers in the middle.
In this given data, the two middle numbers are 6 and 8. We will find the average of the numbers by adding them and dividing by 2.
So, the median of 1, 3, 5, 6, 8, 9, 10, 11 is 7.
Mode
Mode is another measure of central tendency. It is the number that appears the most time in a given data.
Example:
Let’s find the mode of the given number of observations: 9, 7, 2, 9, 6, 1, 3, 9, 5.
- Rearrange the numbers in ascending order. 1, 2, 3, 5, 6,7, 9, 9, 9.
- Count which number appears the most.
- On counting, we found that 9 is the number that appears most (three times) in a given data.
So, the mode of 9, 7, 2, 9, 6, 1, 3, 9, 5 is 9.
Range
The Range is the difference between two numbers (the highest number and the least number) of the given data. Unlike mean, median, and mode, which are measures of central tendency, the range is the measure of dispersion.
How to Find Range
The range can be calculated through a simple method of subtracting the lowest value in the data from that of the highest value.
Example:
We have a data set of 8, 12, 9, 2, 24, 20, 7, 3.
- Rearrange the numbers in ascending order 2, 3, 7, 8, 9, 12, 20, 24.
On rearranging, we found that 2 is the lowest value and 24 is the highest value.
- Subtract the lowest number from the highest number.
So, the range of 8, 12, 9, 2, 24, 20, 7, 3 is 22.
Learn Math with Expert Tutor
Are you looking for an expert online Math tutor to learn math with fun? We have professional instructors to teach you with a schedule that fits you